
5 Cardinal Charts That Help Explain the Long Term Story
As someone who started at Cardinal back in 1998 — and has now been outside the company for 15 years — I do not pretend to know the day to day. But what I can offer is long‑range context that is easy to miss when you are inside the business and focused on the next quarter.
Every so often, I like to share a handful of charts that help illuminate Cardinal’s long‑term story — the kind of charts most employees rarely see, but that reveal something meaningful about the company you have helped build.
Here are five that stood out to me this month.
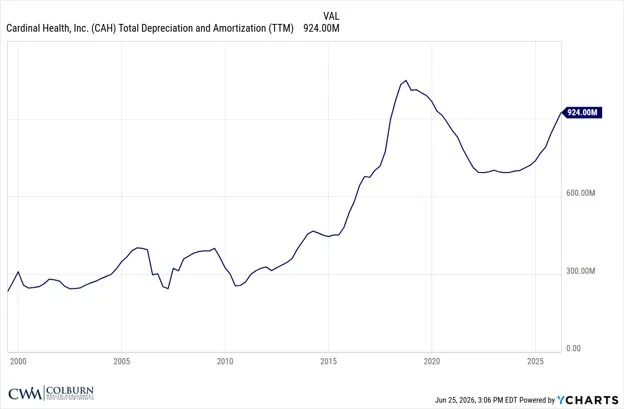
1. Long‑Term Depreciation and Amortization
(A window into long‑range investment and asset renewal)
Depreciation and amortization are not the most exciting lines on a financial statement, but they do tell a story about how a company invests in its infrastructure over time.
This long‑term trend shows a steady rise in the value of assets Cardinal has put to work — distribution centers, technology, automation, and other long‑lived investments that support the scale of the business. Peaks and valleys reflect different investment cycles, but the overall direction points to a company that has continually reinvested in its operational backbone.
It is a reminder that behind every shipment, every order, and every customer interaction sits a massive physical and technological system that has been built over decades.
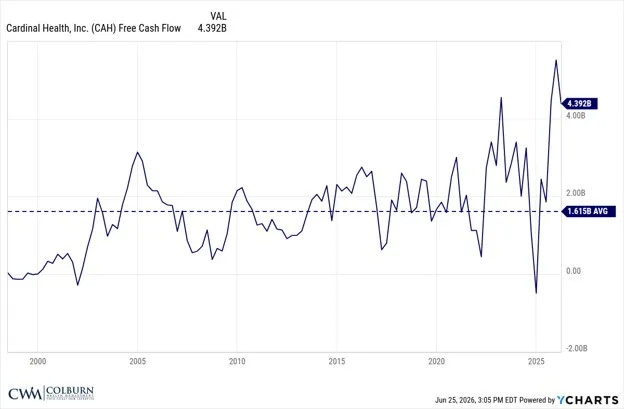
2. Long‑Term Free Cash Flow
(The fuel that powers everything else)
Free cash flow is one of the clearest measures of financial strength. It shows how much cash is left after the company pays for operations and capital investments.
Cardinal’s long‑range free cash flow trend tells a story of resilience. There have been volatile periods, but the overall trajectory shows a business that consistently generates the cash needed to reinvest, pay down debt, and return value to shareholders.
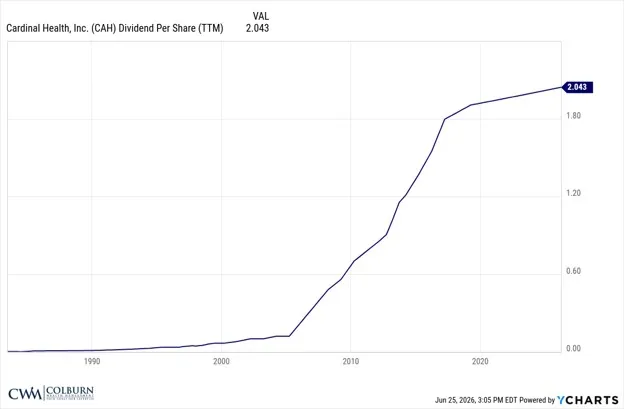
3. Dividend Growth Over Time
(A long record of returning value to shareholders)
Dividends are one of the simplest ways a company signals confidence in its long‑term stability. Much like free cash flow, it demonstrates that a business is profitable enough to pay all expenses, reinvest in the business and still have money left over to reward shareholders with cash distributions.
Cardinal’s dividend per share has climbed steadily for decades. It is not flashy, but it is consistent — and consistency is often the most telling indicator of a company’s underlying health.
For those of you who hold Cardinal stock via RSUs or otherwise, this long‑term dividend growth is a meaningful part of the total return story.
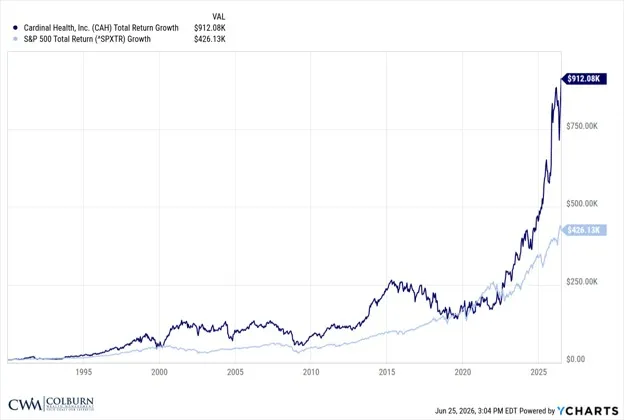
4. Total Return vs. the S&P 500
(A long‑range comparison that surprises many people)
When you compare Cardinal’s total return to the S&P 500 over multiple decades, a clear pattern emerges.
Cardinal has outperformed the broader market over the long run. In fact, a $10K initial investment in CAH would be worth more than twice as much as the same investment in the S&P 500 over this time. This is not something most employees see day to day, but it is part of the company’s long‑term story.
It reflects the power of a business that has grown through industry cycles, adapted to change, and continued to deliver value over time.
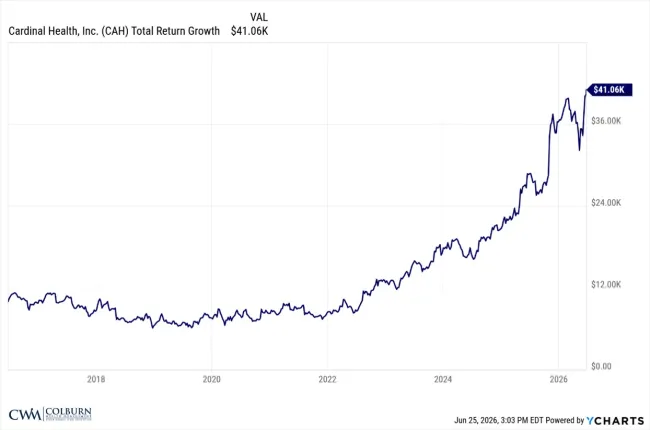
5. Recent Total Return Momentum
(A look at the last decade)
While long‑term charts tell the big story, it is also helpful to look at the more recent trend.
Over the past 10 years, Cardinal’s total return has accelerated meaningfully. $10K invested in Cardinal stock would have grown to over $41K. It reflects operational improvements, strategic shifts, and a market that is recognizing the company’s progress.
For employees, it is a reminder that the work you do today contributes to a much larger arc and is being recognized and rewarded by shareholders.
Closing Thought
None of these charts are about predicting what happens next. They are simply long‑range views that help tell the story of a company that has grown, adapted, invested, and endured through many different chapters.
My hope is that these occasional chart‑based newsletters offer a broader view of the company you have helped build — and a sense of pride in the long‑term impact of your work.
If you ever want to talk through your Cardinal benefits or your own situation, you’re welcome to schedule a relaxed Q&A. No cost, no pressure, and no expectation to meet again — just a chance to talk things through. CLICK HERE TO SCHEDULE
Take care and, as always, stay the course.
Join The Cardinal Clarity Weekly
Colburn Wealth Management, LLC is a registered investment adviser. Information presented is for educational purposes only and does not intend to make an offer or solicitation for the sale or purchase of any specific securities, investments, or investment strategies. Investments involve risk and, unless otherwise stated, are not guaranteed. Be sure to first consult with a qualified financial adviser and/or tax professional before implementing any strategy discussed herein. Past performance is not indicative of future performance.