
5 Cardinal Charts You Might Not Have Seen
While I’m not a Cardinal employee and haven’t been since 2013, I still follow the company closely as a past employee, investor and for my clients who continue to be employees like yourself. If you’re a member of finance, the executive leadership team, etc., these charts might not be new information. For the rest of you, I hope it offers some helpful additional context about Cardinal.
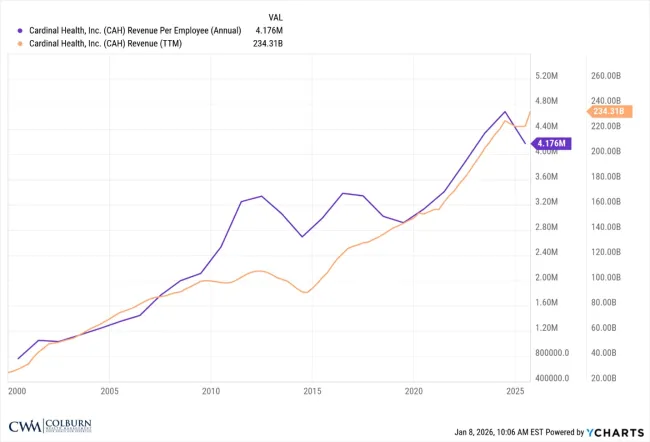
Revenue per Employee
This chart from 2000 to present helps put into context both the effects of inflation and, more specifically, the continued efficiency of you and your peers. Similar dynamics can be seen at major competitors as well. Still, it’s incredible to see how revenue per employee has grown from under $1M to over $4M in 25 years.
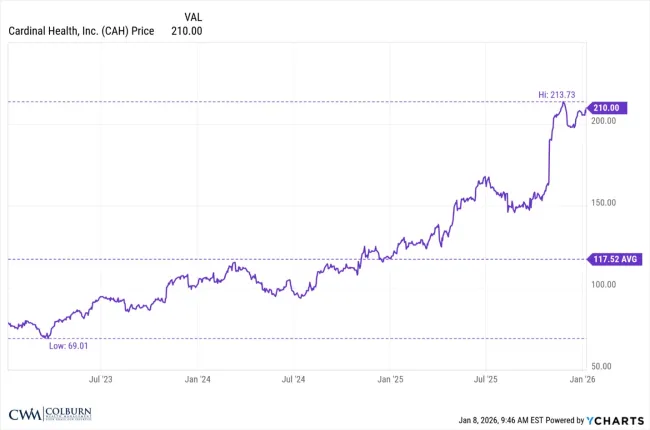
3 Year Performance
This chart is more easily found elsewhere; however, it can be a useful reminder of just how good recent stock performance has been when put into context with low, average and high prices.
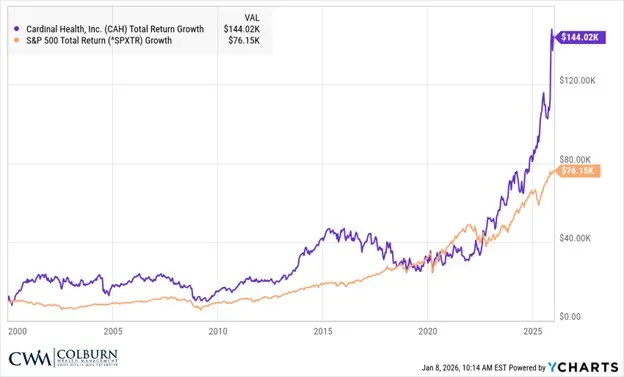
Long-term Performance vs S&P 500
Zooming out even further gives an even clearer picture. While $10K invested in the S&P 500 in 2000 would have turned into an astonishing $76K, Cardinal stock did even better! The same $10K invested in your company would have grown to $144K.
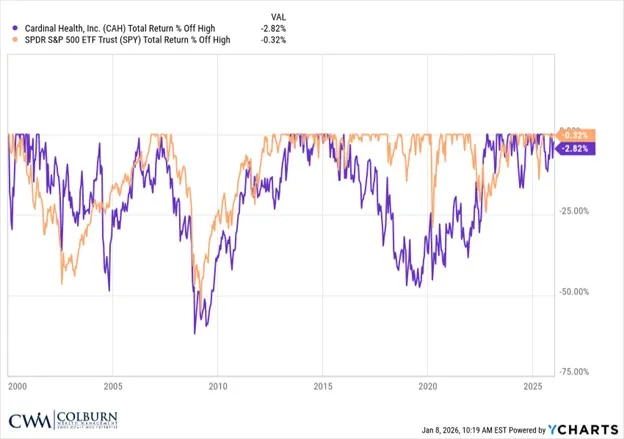
Max Drawdowns
As they say, there is no free lunch however. While the S&P 500 and Cardinal have both performed very well in the past 25 years, that performance did come with moments of fairly severe volatility. During the great financial crisis, Cardinal’s stock dropped over 60% in value with the S&P 500 not too far behind. In general, due to the diversification benefits, the broad stock market didn’t have quite the depth or breadth of declines as Cardinal did.
For those of you who hold significant investments in Cardinal stock, it can be a good reminder that all stocks, especially individual holdings, can lose value and remain low for years at a time.
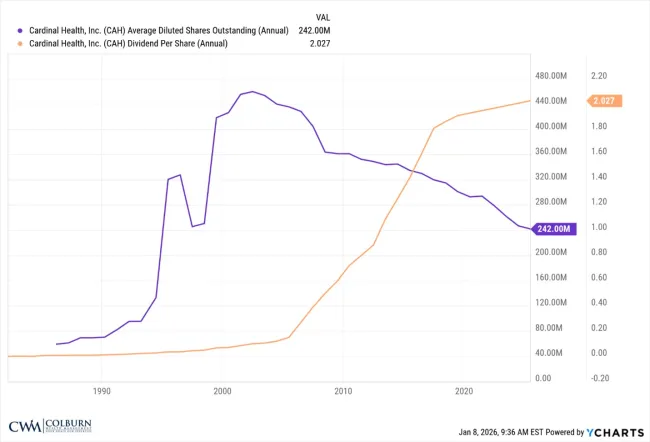
The Long Lense on Cardinal Stock Buybacks
This chart demonstrates the number of CAH shares outstanding in purple. In orange are the cash dividends paid out per share to shareholders. It tells a remarkable story about the arc of many successful companies such as your employer.
Initially, as companies are trying to get established, share issuance is common to help fund rapid growth and seize market opportunities.
When I joined Cardinal in 1998, the company was still largely in that mode, but had begun transitioning into a more mature firm - one that was continuing to grow but also generating profits well beyond what was needed for internal reinvestment.
Starting in the early 2000s, with these excess profits, the company began to issue larger and larger dividends to shareholders. In addition, Cardinal began purchasing their own outstanding shares, driving down share count.
Embarrassingly enough, in those early days as an employee, I remember thinking how insignificant the dividends and share buybacks were in the scheme of things. Years later, those “small dividend increases” have resulted in nearly $9B in cash returned to shareholders. Similarly, over $18B in net share purchases have also occurred over this time, nearly cutting shares outstanding in half!
If you ever want to talk through your own Cardinal benefits or have a question about your situation, you’re always welcome to schedule a relaxed Q&A conversation. No pressure - just a chance to talk things through. CLICK HERE
Take care and, as always, stay the course.
Join The Cardinal Clarity Weekly Newsletter
Colburn Wealth Management, LLC is a registered investment adviser. Information presented is for educational purposes only and does not intend to make an offer or solicitation for the sale or purchase of any specific securities, investments, or investment strategies. Investments involve risk and, unless otherwise stated, are not guaranteed. Be sure to first consult with a qualified financial adviser and/or tax professional before implementing any strategy discussed herein. Past performance is not indicative of future performance.