
5 Cardinal Charts That Help Explain the Long-Term Story
As someone who started at Cardinal back in 1998 — and has now been outside the company for 15 years — I don’t pretend to know the day‑to‑day. But what I can offer is long‑range context that’s easy to miss when you’re inside the business and focused on the next quarter.
Every so often, I like to share a handful of charts that help illuminate Cardinal’s long‑term story — the kind of charts most employees rarely see, but that reveal something meaningful about the company you’ve helped build.
Here are five that stood out to me this month.
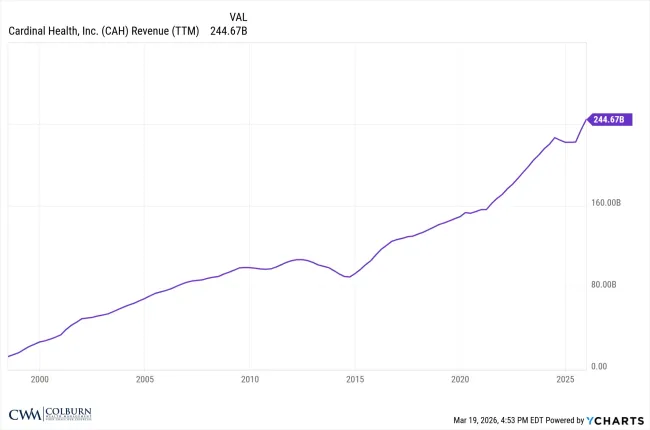
1. Long‑Term Revenue Growth
(How total sales have grown over time)
When you zoom out far enough, a company’s revenue line tells a simple story: scale, evolution, and staying power.
Cardinal’s long‑term revenue trend shows a business that has grown through multiple industry cycles, strategic shifts, and healthcare system changes. It’s a reminder that the company’s role in the supply chain has expanded steadily over time, even as the year‑to‑year picture has had its ups and downs.
This chart isn’t about forecasting. It’s about understanding the scale of the enterprise you’re part of.
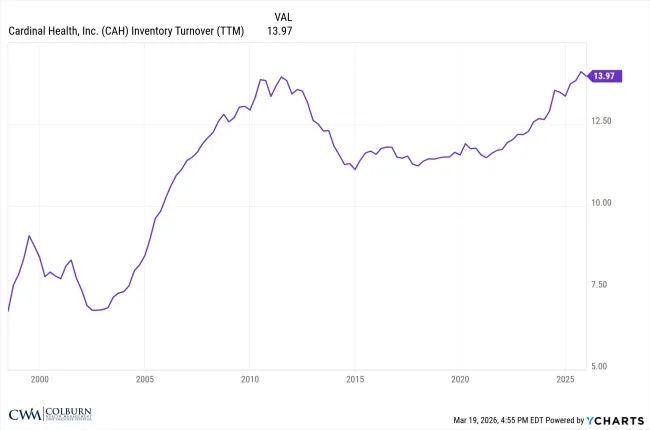
2. Long‑Term Inventory Turnover
(Efficiency of product movement)
Inventory turnover is a window into the engine of the business — how efficiently product moves through the supply chain. In simple terms, higher turnover means product is moving through the system more quickly and efficiently — a sign of a healthy, well‑run distribution engine.
A long‑range view of this metric helps show how Cardinal has managed working capital, optimized distribution processes, and adapted to shifts in customer demand and product mix. It’s a metric that rarely gets attention, but it’s central to understanding the operational backbone of any distributor.
This chart helps illustrate the complexity and precision required to keep the healthcare supply chain running smoothly.
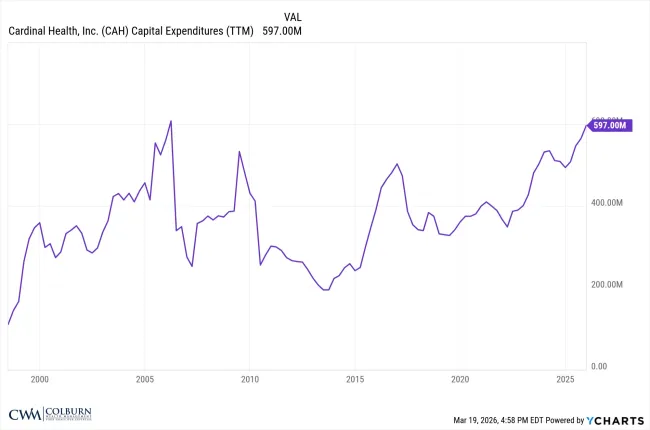
3. Long‑Term Capital Expenditures
(Investment in the future)
Capex isn’t the most glamorous line item, but it’s one of the clearest signals of a company’s long‑term priorities.
A long‑range capex chart shows how Cardinal has invested in distribution centers, technology, automation, and infrastructure over time. These investments often take years to show up in financial results, but they’re essential to maintaining reliability and scale in a complex supply chain.
This chart helps explain the “why” behind many of the operational changes employees have experienced over the years.
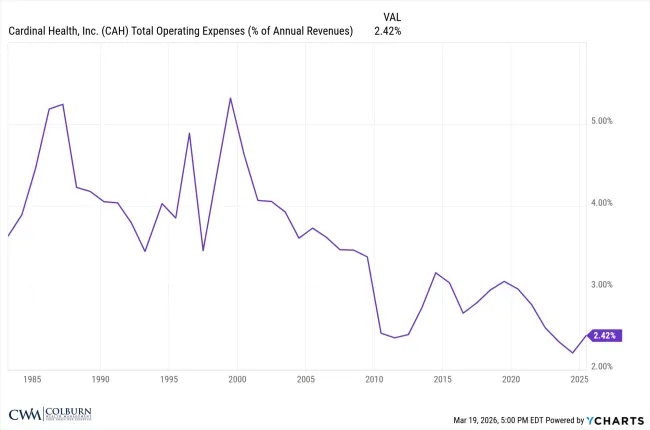
4. Total Operating Expenses as a % of Revenue
(Long-range cost structure)
Operating expenses as a percentage of revenue is one of the clearest ways to understand how a company manages scale and efficiency over time.
For a large distributor like Cardinal, this ratio tends to be remarkably stable. Even as the business grows, adds new capabilities, and adapts to changes in the healthcare system, the overall cost structure often stays within a relatively narrow band.
A long‑term view of this metric helps illustrate:
- how Cardinal manages its operating footprint
- the importance of scale in distribution
- the consistency of the company’s cost discipline
- how the business absorbs new investments over time
It’s a simple chart, but it reveals a lot about how the company operates behind the scenes.
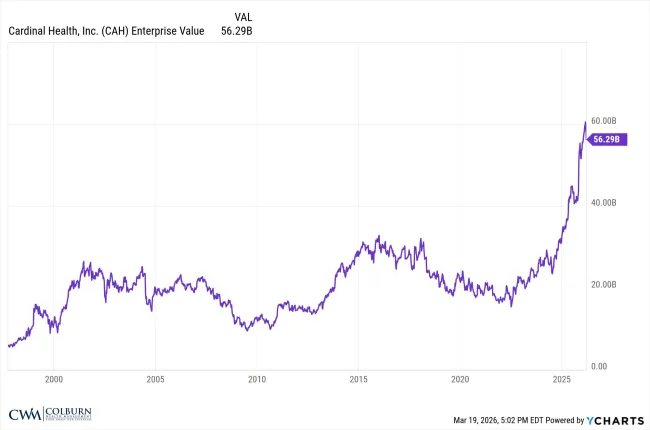
5. Enterprise Value over Time
(Long-range view of Cardinal’s total economic value)
Enterprise value — often shortened to EV — is a way of looking at the overall size of a company. Instead of focusing only on the stock price, EV combines several pieces of information to give a more complete picture of the company’s total economic value.
The simplest way to think about it is this:
Enterprise value reflects the value of the entire business — its operations, assets, and financial structure — all in one number.
It includes:
- the value of all outstanding shares
- the company’s debt
- and its cash position
Because of that, EV is often used as a broader measure of scale than market capitalization alone.
A long‑term enterprise value chart helps show how Cardinal’s total economic value has evolved through different market environments, strategic shifts, and industry cycles. It’s a helpful way to understand the company’s overall size and how it has changed over time.
This chart isn’t about predicting anything. It’s simply a long‑range view of how the market has valued the full enterprise — not just the stock — which can offer useful context about the company’s long‑term trajectory.
Closing Thought
None of these charts are about predicting what happens next. They’re simply long‑range views that help tell the story of a company that has grown, adapted, invested, and endured through many different chapters.
My hope is that these occasional chart‑based newsletters offer a broader view of the company you’ve helped build — and a sense of pride in the long‑term impact of your work.
If you ever want to talk through your Cardinal benefits or your own situation, you’re welcome to schedule a relaxed Q&A. No cost, no pressure, and no expectation to meet again — just a chance to talk things through. CLICK HERE TO SCHEDULE
Take care and, as always, stay the course.
Join The Cardinal Clarity Weekly
Colburn Wealth Management, LLC is a registered investment adviser. Information presented is for educational purposes only and does not intend to make an offer or solicitation for the sale or purchase of any specific securities, investments, or investment strategies. Investments involve risk and, unless otherwise stated, are not guaranteed. Be sure to first consult with a qualified financial adviser and/or tax professional before implementing any strategy discussed herein. Past performance is not indicative of future performance.